
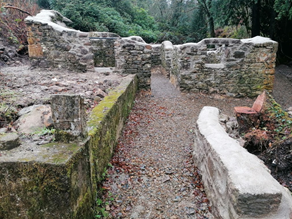
There are heritage sites along all these trails such as the restored Crag river bridge and the partly restored Mary Anne’s stone cottage. Other heritage sites include the ruins of Dysart Lyons and Brohan’s homesteads, a famine road, Mion Rua bog and recreational areas known as Mass Place and the Stepping Stones. There is also a Fairyland facility for young families and a Kindness Rocks trail with a mental health theme.
These walking trails are mostly located in the townlands of Belvoir, Crag, Snaty Wilson, Snaty Massy and Ballyvourgal. Belvoir is low-lying on the banks of the O’Garney River and was the residence of the Wilsons, the former landlords of the area. Unusually, the Wilsons were Catholics. They became the Wilson-Lynchs when the family inherited land in Co. Galway. Crag is the next townland, somewhat higher than Belvoir. The land in Crag is of middling to poor quality. An extensive dry-stone wall was built of sandstone, the remains of which can still be traced separating the lower good land from the upper poor land. The selection of the walking routes was helped by the existence of a roadway, now in poor condition, running in a north-west to south-east direction between Belvoir and Oatfield. This roadway was built during the Famine to provide employment to starving people. Another road was started, running from Crag in a southerly direction towards Cooleycasey. This road was not finished. However, the track of the road can be seen and walked. On this road one can see, with difficulty, the ruins of a settlement cluster which once had 12 houses and two lime kilns. Also, a short distance from here on the opposite side of the road is the ruins of a substantial dwelling in the trees. From Crag, a road was proposed to run in a north-easterly direction through two settlements clusters towards Broadford. This was not built. It is clear that a significant population lived and worked in the area at some stage. Modern maps give very little clue as to where the population lived as the area we are looking at is now forestry with open areas of bog and heather on higher ground. We have to go back to the 1840s and work forward to see to see where the population lived and who they were.
In the 1840s, ‘50s and ‘60s, the parliament in London authorised the preparation of extensive studies and surveys of the condition of Ireland. The OS produced a set of 6” to 1 mile maps for the whole country, publishing Co. Clare in the 1840s. These maps were updated in 1893 to a scale of 25” to 1 mile. Accurate censuses were done for 1841, ’51 and ’61. During the 1840s, Sir Richard Griffith supervised the carrying out of a property tax survey, now widely known as Griffith’s Valuation. This survey produced tables of peoples’ names, land acreage and valuations. The tables were cross-referenced to plots marked up in red on the newly published OS 6” maps.

2012 with the gables intact, but note the position of the trees

2014 after Storm Darwin knocked the trees onto the gables, they are no longer there
 AFTER
AFTER
 BEFORE
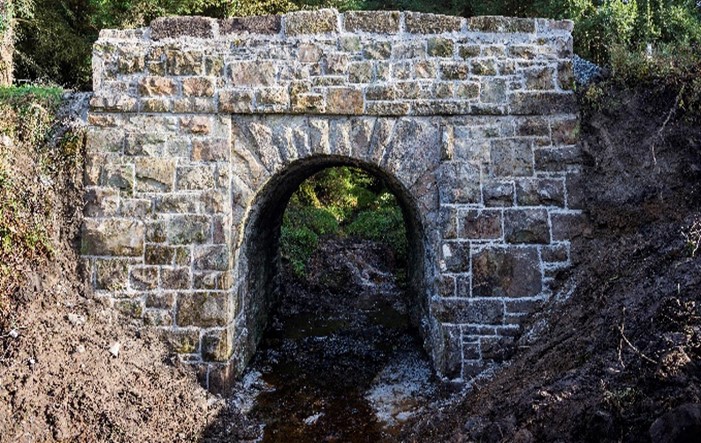
Upper Crag Bridge restored in 2016 and funded by the Heritage Council
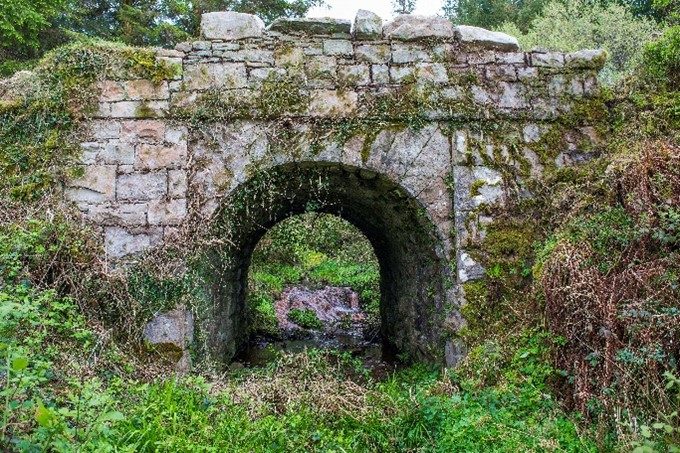
2020 partly restored with funding from the Heritage Council, well worth a visit
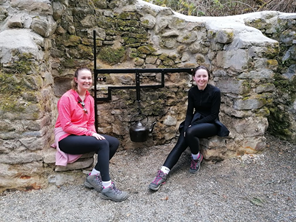
Our theme with this restoration project is to create a picture of how life was growing up in say the mid 1950’s
In 1841, the population of this area was 600. The following table shows how the population declined between 1841 and 1901.
Population | Crag | Snaty Wilson | Snaty Massy | Snaty Cooper | Belvoir | Totals |
1841 pop | 200 | 39 | 108 | 104 | 149 | 600 |
1851 pop | 129 | 21 | 11 | 28 | 101 | 290 |
1861 pop | 99 | 20 | 17 | 17 | 56 | 209 |
% change ’41 to ’61 | -51 | -49 | -84 | -84 | -62 | -65 |
1901 pop | 61 | 11 | 10 | 19 | 26 | 127 |
The population decline between 1841 and 1851 was very rapid due to the Great Famine of 1845 to 1852. The decline continued as landlords no longer wanted the trouble of collecting rent from very hostile people and herds of animals were more profitable. In addition, the rents on properties with a valuation of less than £5, as calculated by the Griffith surveyors had to be paid by the landlord. In our area, this represented about 20 acres of mountainous land. The landlords naturally did not want to do this and so landholders who survived the disease and starvation of the famine were encouraged to emigrate. Former small plots were combined into larger units and then rented out.
The number of houses also declined as there was nobody available to re-occupy them once they were empty. They were used as animal sheds by the people who survived and were allowed to rent land. The chart below shows the decline in house numbers. Dividing the population number of a townland by the number of houses in the townland gives an average number of people in each house. This works out at between 5 to 6 people per house. Of course, house is a misnomer. The majority of dwellings were single roomed, with all domestic functions happening in that room.
No. of Houses | Crag | Snaty Wilson | Snaty Massy | Snaty Cooper | Belvoir | Totals |
1841 houses | 30 | 5 | 21 | 14 | 25 | 95 |
1851 houses | 19 | 5 | 3 | 4 | 20 | 51 |
1861 houses | 16 | 4 | 3 | 2 | 13 | 38 |
% change ’41 to ’61 | -47 | -20 | -86 | -86 | -48 | -60 |
1901 houses | 15 | 2 | 3 | 3 | 8 | 31 |
The present population of our area is about 100 people, with almost all living in low-lying Belvoir. Forestry covers most of the higher parts of the area, with bogs and mountainous heather-clad wet soils at the highest level. The last four families moved out of the high land in the 1970s. The location of three of these houses are on the walking trail route and may be visited. And, to end on a positive note, the fourth house has been restored and has been re-occupied.
12 O’Clock Hills, Belvoir, Sixmilebridge Co. Clare
Copyright © 2021 All Rights Reserved.
Website Design by www.ottmarketing.ie & Adept Digital Solutions